TIMELINES
WELCOME TO THE SECOND TERM 2016.
Here you are some useful information to get into timelines this second ter.
How to Make a Timeline in Excel

Here you are some useful information to get into timelines this second ter.
How to Make a Timeline in Excel 
A timeline is a type of chart which visually shows a series of events in chronological order over a linear timescale. The power of a timeline is that it is graphical, which makes it easy to understand criticalmilestones, such as the progress of a project schedule. Timelines are particularly powerful for project scheduling or project management when paired with a gantt chart as shown below.
Timeline example:
Manually Create an Excel Timeline Template
1. List your key events and dates in an Excel 2007, 2010, 2013 and 2016 table
- List out the key events, important decision points or critical deliverables of your project. These will be called Milestones and they will be used to create a timeline.
- In Excel 2007, 2010, 2013 and 2016 create a table out of these Milestones and next to each milestone add the due date of that particular milestone.
- To create a timeline in Excel, you will also need to add another column to your table that includes some plotting numbers. Add a the new column next to your milestone description column and list out a repetitive sequence of numbers such as 1, 2, 3, 4 or 5, 10, 15, 20 ect. Excel will use these plotting points to vary the height of each milestone when plotting them on your timeline template.
- For this demonstration I will turn the following table into an Excel timeline template, and then I will also use it again make a timeline in PowerPoint.
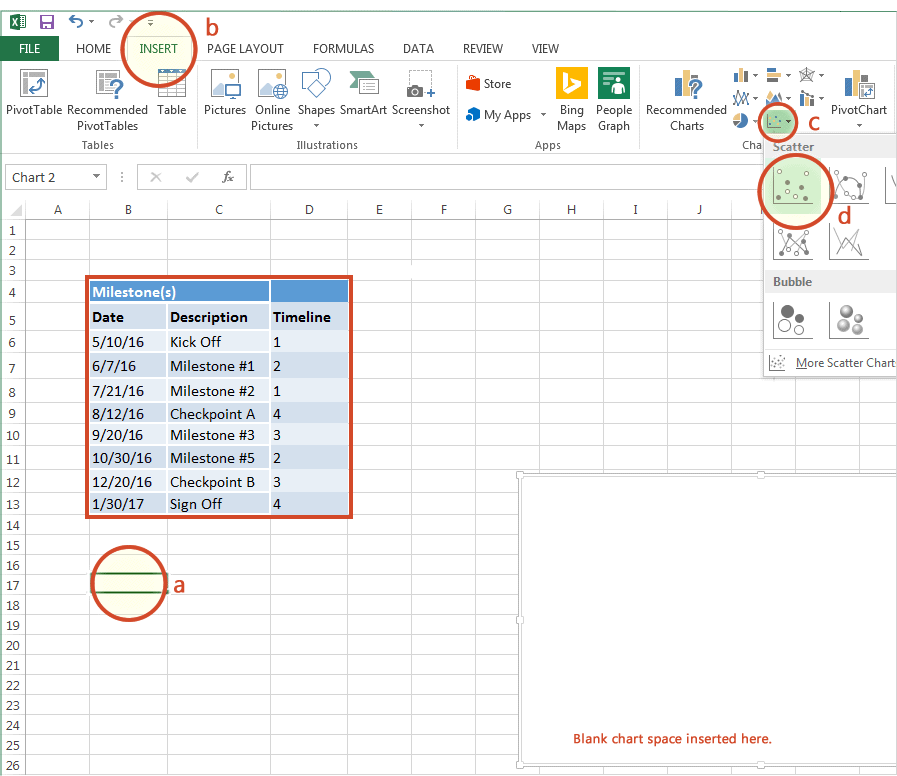
2. Make a timeline in Excel by setting it up as a Scatter Bar chart
- From the timeline worksheet in Excel, click in any blank cell.
- Then from the Excel ribbon, select the Insert tab and in the Charts section of the ribbon, drop down the Bar Chart selection menu.
- Select Scatter Chart which will insert a blank white chart space onto your Excel worksheet.

Comments
Post a Comment